Key Takeaways
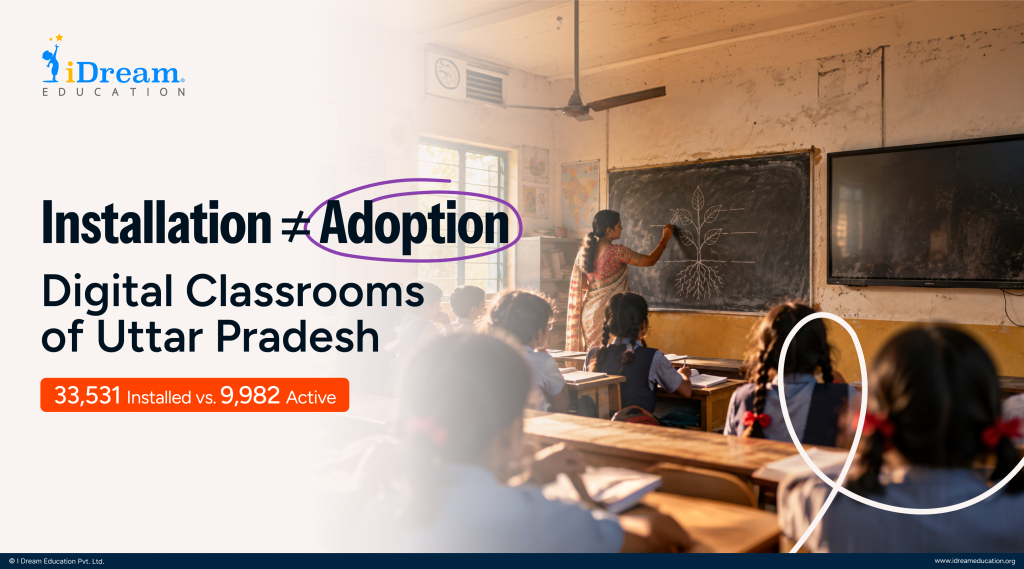
- Digital classroom implementations across Uttar Pradesh show a gap between installation and use, with a state review finding only 9,982 of 33,531 installed devices active – a 38% utilisation rate – per reporting from The Times of India’s Prayagraj Bureau.
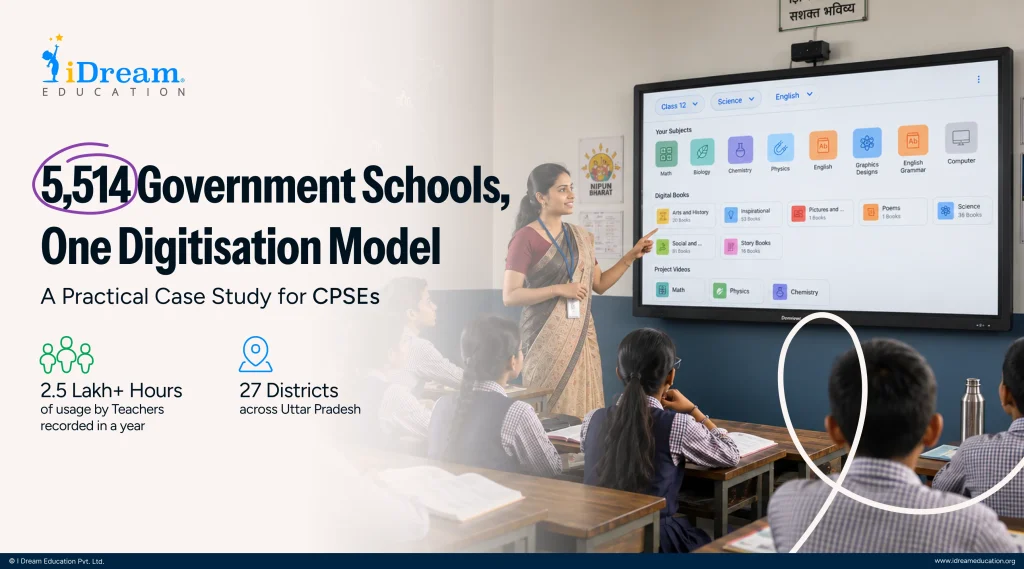
- iDream Education’s implementation with the Basic Education Department reaches over 5,000 schools across 28 districts, each equipped with a Smart Classroom Panel loaded with NCERT- and NIPUN Bharat-aligned content.
- Teachers in this implementation received a single round of training at the district level before the platform went live, with no repeat visits or ongoing check-ins built into this phase.
- 86% of schools recorded usage for four or more months, while 60% recorded usage for seven or more months, remaining active in at least one of the final three months tracked.
- Schools with the longest sustained usage also used the platform more intensively, logging a median of 332 minutes per active month, compared with 17 minutes for schools active for only one month.
- Although iDream’s 60% figure vs the statewide 38% figure are measured differently, this is a signal to weigh, not a settled conclusion.
Digital classroom implementations in Uttar Pradesh have struggled to move from installation to sustained use. While panels are mounted, content is loaded, and training sessions are delivered, adoption vs usage statistics show no positive trend. As implementation teams move from school to school, the early enthusiasm for learning in a digitised classroom wears off as school routines take over.
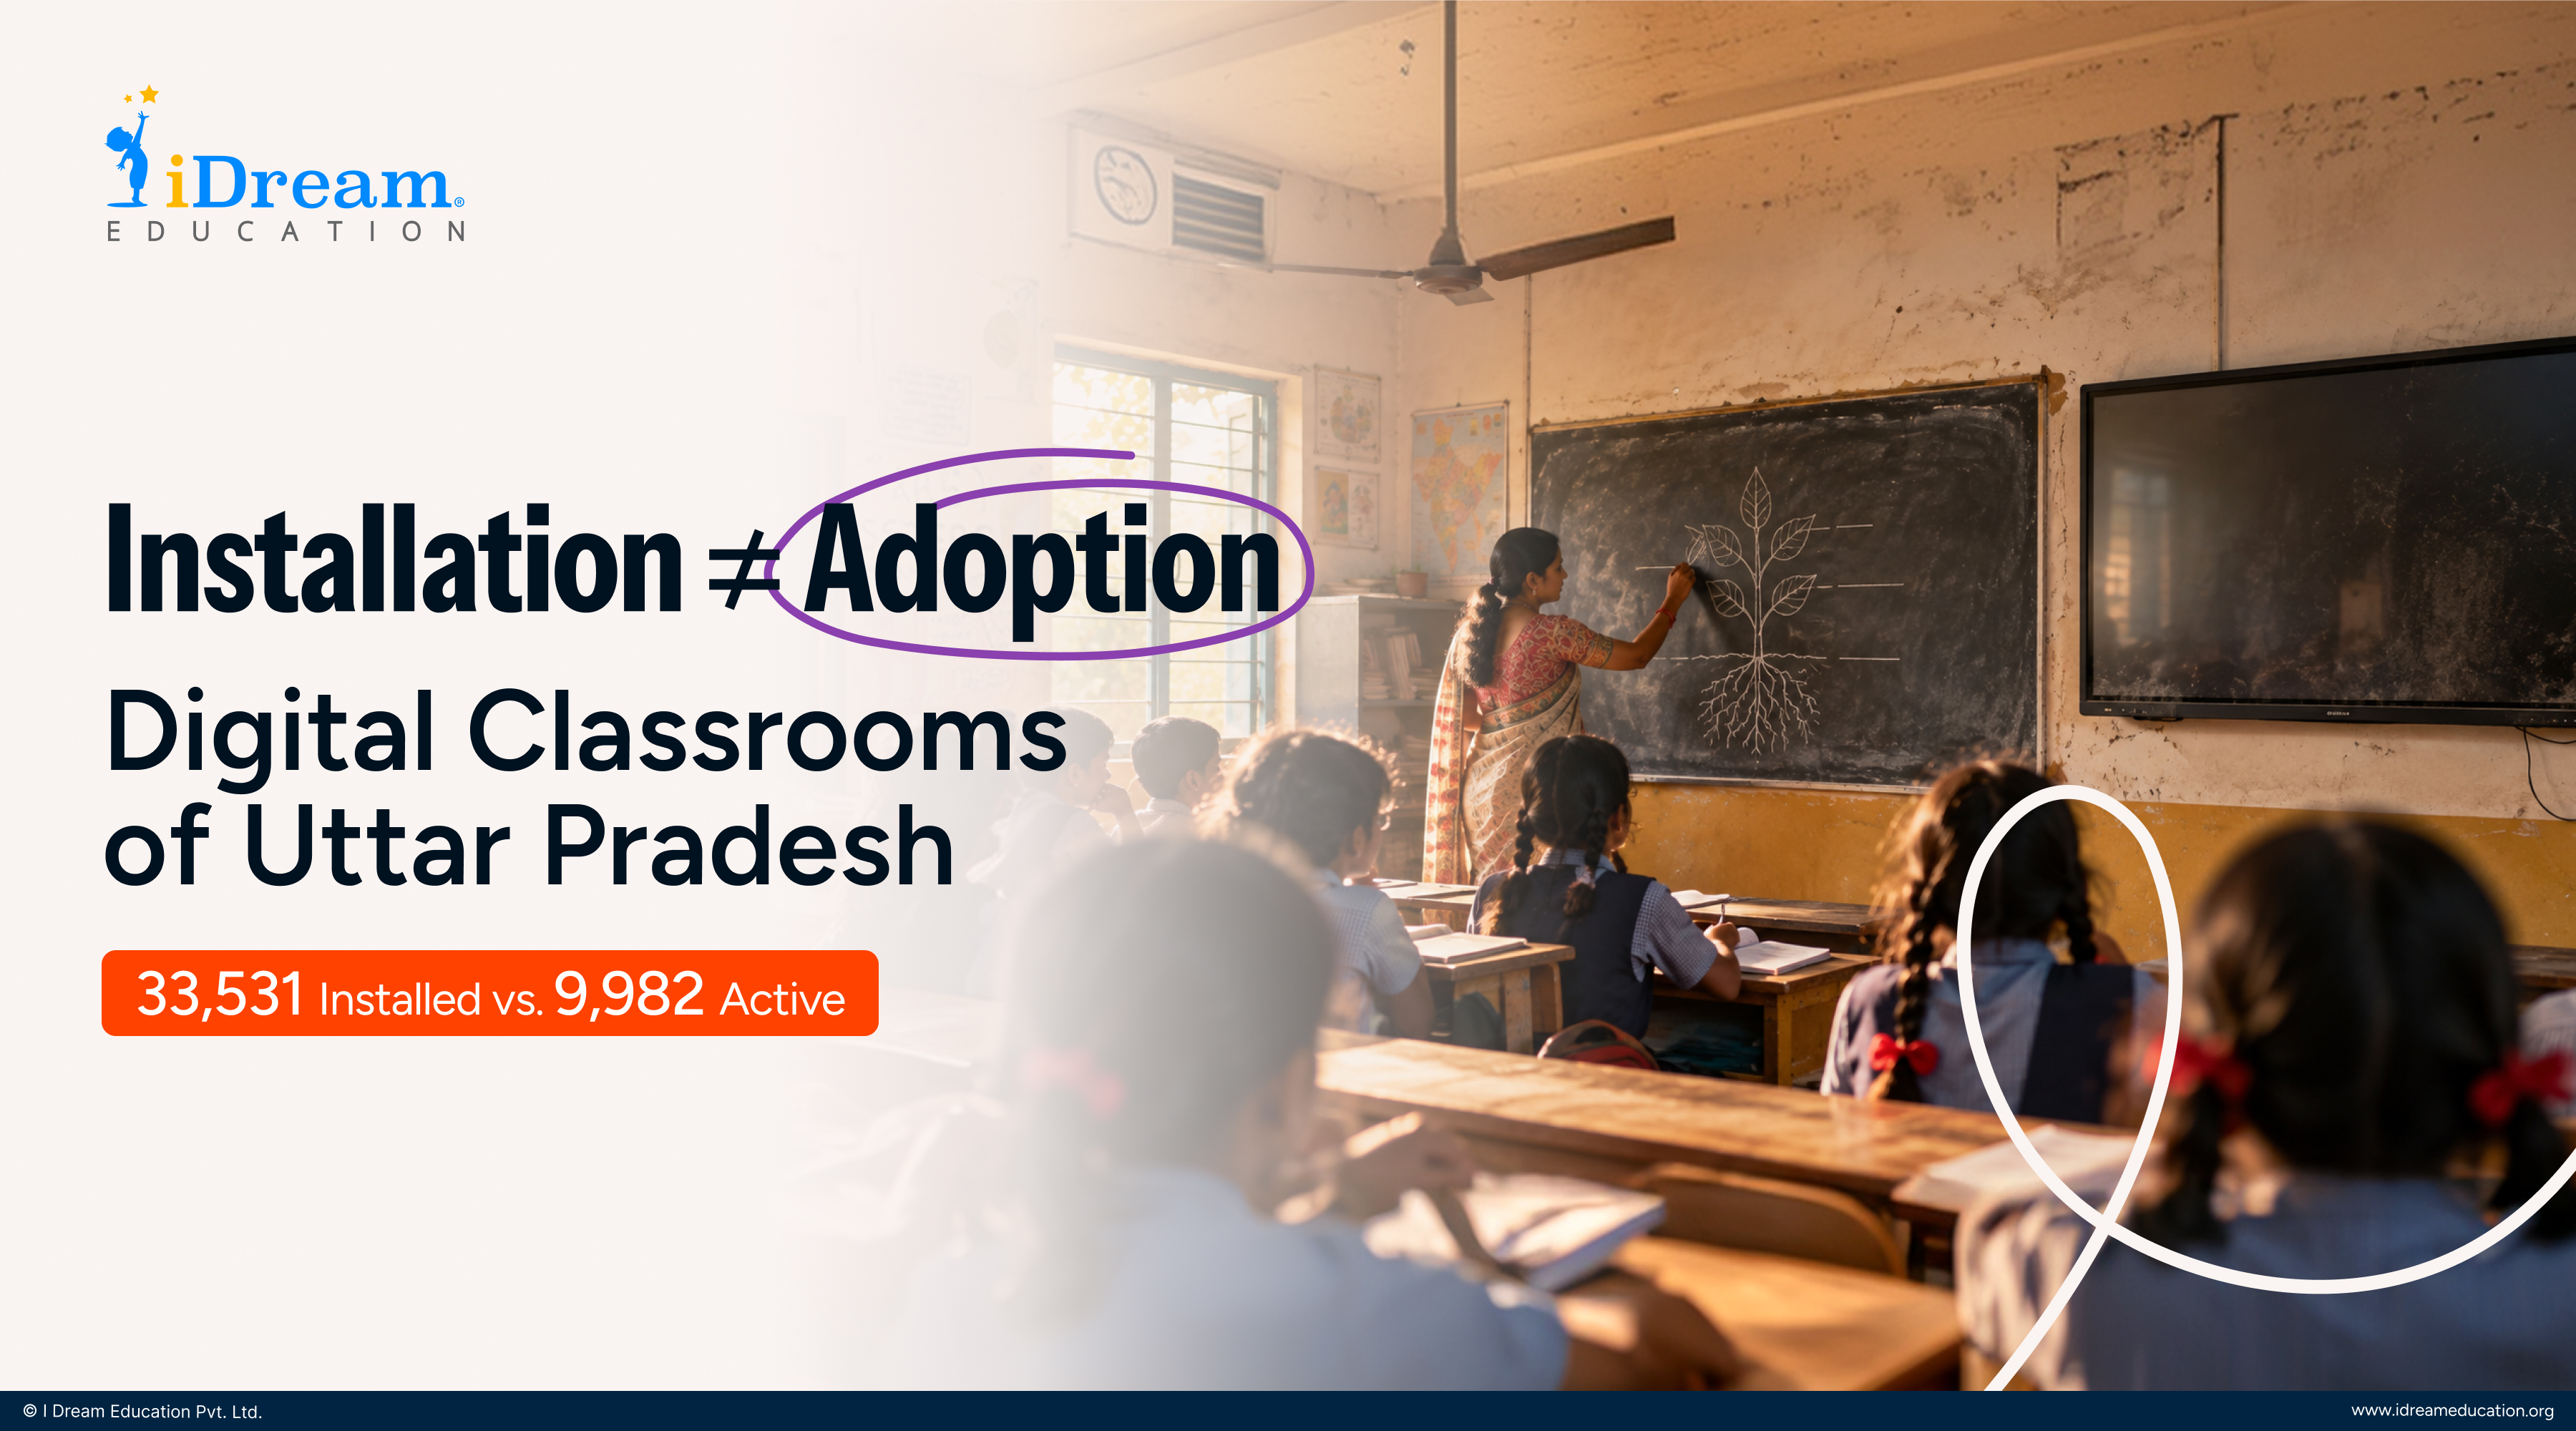
According to a Times of India report, an official state review conducted by Monica Rani, the state project director, found that of 33,531 smart-classroom devices provided to schools across Uttar Pradesh, only 9,982 were active – pulling the statewide device-utilisation rate down to 38%, as reported by Times of India’s Prayagraj bureau. This number sits at the centre of the debate: what happens once a device is installed in a classroom, and how many are still switched on months later?
Adoption vs usage of digital classrooms in Uttar Pradesh
At the ground level, the debate isn’t really about whether digital classrooms will ever belong in government schools. It’s about what happens between a panel being installed and a teacher using it on an ordinary day in their class.
- Is the training delivered once, and forgotten?
- Is it the content that doesn’t match what a teacher is meant to be covering that week?
- Is it that a panel switched on for a demonstration during rollout was never really adopted as a teaching tool after installation?
Implementations across Uttar Pradesh have been asking all three questions at once.
iDream and UP implementation trends: what’s changed?
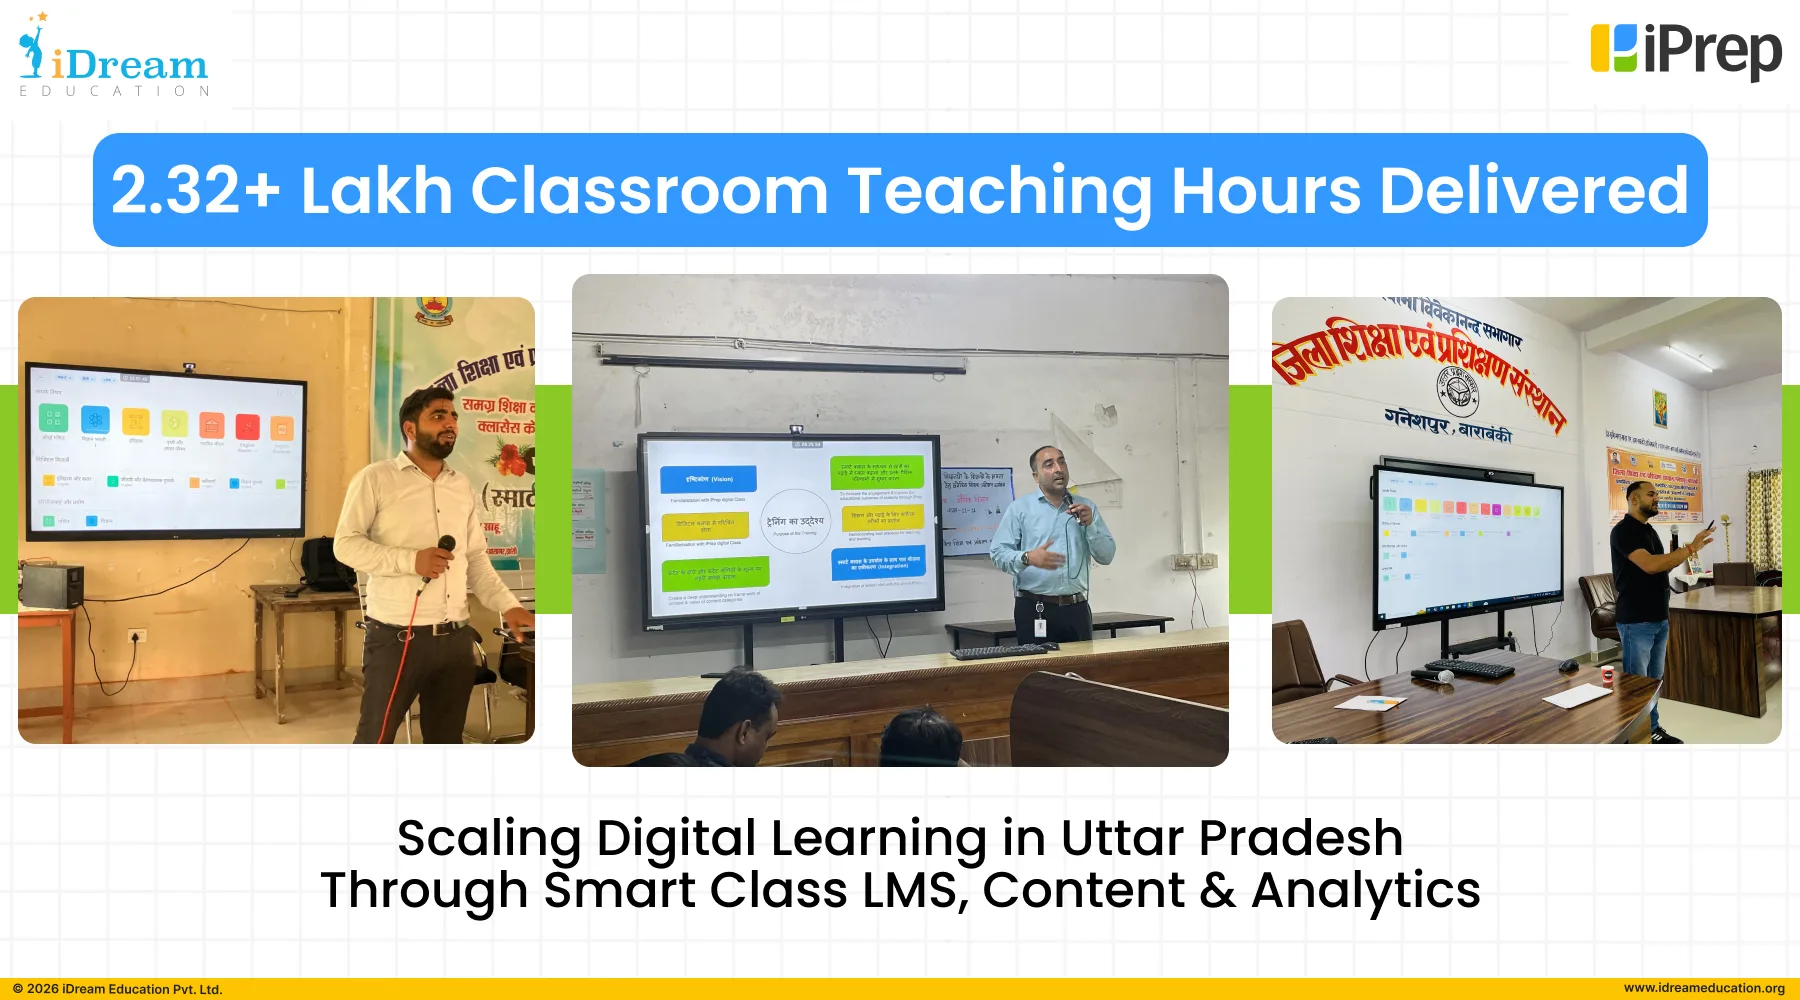
iDream Education’s implementation with the Basic Education Department has run in the same state, under the same broader set of conditions, since 2024. It now reaches more than 5,000 schools across 28 districts. Each school has at least one Smart Classroom Panel, loaded with content aligned to the National Council of Educational Research and Training (NCERT) curriculum and the National Initiative for Proficiency in Reading with Understanding and Numeracy (NIPUN Bharat) framework. Teachers were trained once at the district level before the platform went live in schools.
That’s the baseline: a panel, curriculum-aligned content, and a single training session. The systems were not designed to ensure proactive usage, teacher engagement, or regular check-ins.
What happens after teachers and students log in?
Usage data from 2024 to 2026 shows what teachers did after the training ended and implementation teams left the ground.
86% of schools recorded usage in four or more months. 60% recorded usage across seven or more months and were still logging activity in at least one of the final three months tracked. Schools that stayed active longest also used the platform more heavily while active: those active for a single month logged a median of 17 minutes of use that month, while those active for 13 months or more logged a median of 332 minutes per active month.
The comparison between state-level and these implementations surfaces the pattern: schools didn’t just keep up the usage – the ones that returned longest used the platform nearly 20 times more per active month than the ones that tried it once and stopped.
What changed? The content on the panel was already built around what teachers were meant to be teaching that term. The training session was designed to get teachers comfortable enough to start using the platform on their own – not to make further support unnecessary.
One round of training was enough to get teachers started. Content that stayed relevant to what they were already teaching appears to have supported continued use after that – though the data doesn’t establish that either factor, on its own, caused sustained usage.
From device distribution to impact
Whether organic usage of digital classrooms across schools is fully solved is a question for another day. The fundamental question right now is what comes next after devices enter the classroom: ease of adoption and whether a sufficiently trained workforce leads the change every day.
After a single round of district-level training and curriculum-aligned content, this cohort sustained use at 60% over seven or more months. That sits well above the 38% recorded statewide, measured as use continuing past the first few months – though the two figures aren’t tracking identical definitions of “sustained,” so this is a signal to weigh rather than a verdict to declare.
What would move that number further is the open question the next several pieces in this series will work through.
To be continued…
Frequently Asked Questions -
1. What is the "adoption vs usage" problem in Uttar Pradesh's digital classroom rollouts?
Across Uttar Pradesh, the issue isn't whether digital classrooms belong in schools; it's what happens once installation teams leave. A state review found only 9,982 of 33,531 installed devices active – a 38% utilisation rate. The open question is whether training, content relevance, or one-off installation is driving that gap.
2. How large is iDream Education's digital classroom implementation in Uttar Pradesh?
Running since 2024, iDream Education's implementation with the Basic Education Department reaches more than 5,000 schools across 28 districts. Each school has a Smart Classroom Panel loaded with NCERT- and NIPUN Bharat-aligned content, backed by a single round of district-level teacher training before launch.
3. What usage figures has iDream's Uttar Pradesh implementation recorded?
From 2024 to 2026, 86% of schools recorded usage for four or more months, and 60% for seven or more months. Usage also intensified with tenure: schools active 13 or more months logged a median of 332 minutes per active month, against 17 minutes for one-month schools.
4. How does iDream's sustained-usage figure compare to the statewide average?
iDream recorded 60% sustained use, meaning schools stayed active for seven or more months, versus a statewide figure of 38%, which measures the share of installed devices found active at a single point in review. The two figures track different things – one measures ongoing engagement over time, the other a one-time utilisation snapshot – so this isn't a direct comparison, though both speak to how much installed capacity is genuinely being used.
5. What has iDream identified as contributing to sustained platform use?
Two factors stand out: content already matched what teachers were meant to teach that term, so it required no extra effort to use. One round of district-level training appears to have been enough to get teachers started.
6. What does this data mean for future digital classroom implementations in Uttar Pradesh?
The data doesn't mean usage is a solved problem – the real question is what happens after devices enter classrooms, and whether training is sufficient to sustain use. iDream's figures beat the statewide benchmark, but the rest of this series explores what additional support could push that further.
Categories You may Explore
Related Articles