Key Takeaways
- India’s pupil-teacher ratio (PTR) improved across all four school stages (foundational, preparatory, middle, and secondary) in 2024-25. The national teacher count crossed 1 crore for the first time.
- The secondary stage saw the largest decade-long improvement: the national PTR fell from 31:1 in 2014-15 to 21:1 in 2024-25. (A lower PTR means fewer students per teacher, and more scope for individual attention.)
- At the higher secondary stage (Classes 11-12), state-level gaps are significant. Jharkhand’s PTR stands at 47:1; Chhattisgarh’s at 12:1.
- Andhra Pradesh, Uttar Pradesh, and Jharkhand have the highest number of single-teacher schools, among the 1,04,125 in India, where no state average applies.
- In states where higher secondary PTR exceeds 35:1, Jharkhand, Maharashtra, Odisha, and Uttar Pradesh, consistent individual teacher attention becomes difficult to sustain. Programme design must account for this before reaching the school.
When a secondary school teacher in Jharkhand walks into her classroom, she is, on average, responsible for 47 students. In Chhattisgarh, the same figure is 12. Both are government schools within the same national policy framework, yet with vastly different pupil-teacher ratios.
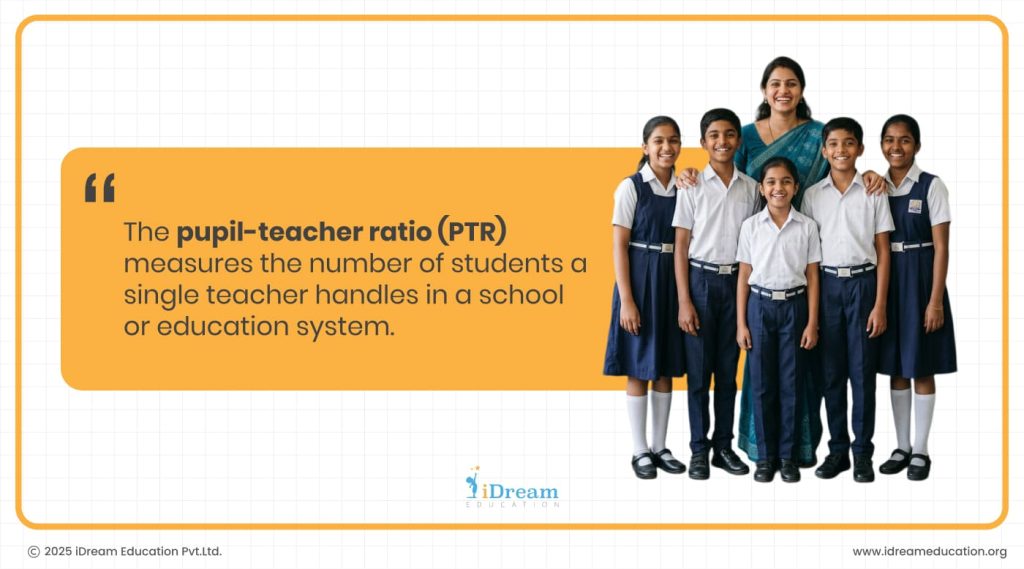
The pupil-teacher ratio (PTR) measures the number of students a single teacher handles in a school or education system. PTR is closely tracked because it shapes how much individual attention is structurally possible, particularly at the secondary level, where subject specialisation matters most.
PTR norms were first introduced in the Right to Education (RTE) Act, 2009, for elementary schools. Then the National Education Policy (NEP) 2020 benchmarked a 30:1 ratio across all school stages. Following that, India’s most recent data, from UDISE+ 2024-25, shows PTR improvements at the national level. However, the state-level picture tells a more uneven story.
For organisations designing or funding government school programmes, PTR is more than a statistic. It is a planning input.
About UDISE+ and How PTR Is Measured
Unified District Information System for Education Plus (UDISE+) is the Ministry of Education’s official school education database. Their 2024-25 report covers approximately 14.71 lakh schools, 24.69 crore students, and over 1 crore teachers across India. [1]
UDISE+ organises PTR data across the four school stages defined under NEP 2020:
- Foundational (Pre-primary to Class 2),
- Preparatory (Classes 3–5),
- Middle (Classes 6–8), and
- Secondary (Classes 9–12).
The National Picture: A Decade of Consistent Improvement
All four national PTRs now sit within NEP 2020’s recommended benchmark of 30:1. This is the first time all four stages have met the target simultaneously. That reflects sustained investment in teacher recruitment and deployment over the past ten years.
| School Stage | 2014-15 | 2022-23 | 2023-24 | 2024-25 |
| Foundational | 15:1 | 11:1 | 10:1 | 10:1 |
| Preparatory | 18:1 | 14:1 | 13:1 | 13:1 |
| Middle | 26:1 | 18:1 | 18:1 | 17:1 |
| Secondary | 31:1 | 23:1 | 21:1 | 21:1 |
Source: Ministry of Education[1], UDISE+ 2024-25 (PIB, 28 August 2025); [2] UDISE+ 2022-23 Report Booklet; [3]Economic Survey 2024-25, PIB
A quick look at the data across school levels shows PTR at secondary education level had the biggest improvement: from 31:1 in 2014-15 to 21:1 in 2024-25, a 10-point improvement.[2]
A significant part of that shift comes from teacher recruitment. The national teacher count grew 6.7%, from 94,83,294 in 2022-23 to 1,01,22,420 in 2024-25. More teachers distributed across the same student base directly improved the ratio at each stage. [1][2]
State-Level Variation: Where the Gaps Are Widest
While the national average now meets the NEP benchmark, state figures vary considerably. The biggest pattern is that higher secondary classrooms show the widest variation across states.
The table below shows the number of students per teacher across all four stages for a representative set of states
Note: The national figures in the table follow UDISE+’s NEP 2020 stage structure, as published in the 2024-25 press release. State-level PTR data from the same dataset is reported in the traditional four-level classification: Primary, Upper Primary, Secondary (Classes 9-10), and Higher Secondary (Classes 11–12), used throughout UDISE+’s detailed state-level analysis.
| State | Primary (Class 1–5) | Upper Primary (Class 6–8) | Secondary (Class 9–10) | Higher Secondary (Class 11–12) |
| Ladakh | 5 | 3 | 5 | 8 |
| Sikkim | 6 | 6 | 5 | 7 |
| Himachal Pradesh | 13 | 8 | 6 | 9 |
| Chhattisgarh | 18 | 15 | 14 | 12 |
| Madhya Pradesh | 16 | 14 | 14 | 15 |
| Rajasthan | 18 | 12 | 11 | 15 |
| Kerala | 22 | 18 | 13 | 20 |
| Andhra Pradesh | 21 | 15 | 10 | 30 |
| Odisha | 16 | 15 | 16 | 37 |
| Maharashtra | 24 | 24 | 20 | 37 |
| Uttar Pradesh | 20 | 22 | 22 | 35 |
| Jharkhand | 26 | 24 | 30 | 47 |
Source: [5] Education For All in India, Analysis of Pupil-Teacher Ratios in India by Level of Education (UDISE+ 2024-25)
Where Teacher Load Is Highest
The national higher secondary PTR is 23:1, but four large states exceeded that as of 2024-25: [5]
- Jharkhand: 47:1
- Maharashtra: 37:1
- Odisha: 37:1
- Uttar Pradesh: 35:1
Andhra Pradesh has 30:1 (exactly at the NEP benchmark) at the higher secondary stage, though its secondary (classes 9-10) PTR is only 10:1; one of the lowest in the country for that level. Jharkhand’s pattern is different. Its secondary (Classes 9-10) PTR is 30:1, exactly at the NEP 2020 benchmark. Its higher secondary PTR is 47:1, more than double the national average for that stage.
Where Ratios Stay Low
Small or sparsely populated states, Ladakh, Sikkim, Lakshadweep, and Himachal Pradesh, record consistently low PTRs across all stages. Low PTR here often reflects population density and school size rather than a surplus of teaching capacity.
Among large states, Chhattisgarh (12:1), Madhya Pradesh (15:1), and Rajasthan (15:1) sit well below the national secondary average, despite having comparable school systems and enrolment sizes to neighbouring high-PTR states. [5]
Single-Teacher Schools
As of 2024-25, 1,04,125 schools in India operated with a single teacher. Andhra Pradesh (12,912 schools), Uttar Pradesh (9,508), and Jharkhand (9,172) have the highest number of such schools. [6] In these schools, one teacher handles every student, every subject, every class.
What the Data Means for Programme Design
A state or national PTR average does not describe every school within that state. Any programme built on averages alone is working with an incomplete picture.
PTR is an input on what is possible in a classroom given the number of students a teacher needs to manage. It does not tell you what to teach or how to train teachers. It tells you what kinds of support are structurally feasible in a given context. That distinction matters when designing education programmes for government schools.
- Where PTR is low (foundational and preparatory stages, or large states like Chhattisgarh and Rajasthan):
The ratio leaves room for teacher-led approaches. A PTR of 10:1 or 12:1 means a teacher can give individual attention and provide direct instructional feedback during a normal school day. Investment in teacher capacity, lesson quality, and classroom practice further improves the learning outcomes.
- Where PTR is high (secondary level in Jharkhand, Maharashtra, Odisha, or Uttar Pradesh):
A PTR of 47:1 means each teacher manages more than double the national secondary average. At that scale, consistent individual attention becomes difficult to sustain at that scale. Teacher training matters, but it doesn’t change the ratio. What helps is structured, self-paced practice that students can work through on their own.
Why the Same Intervention Won’t Work in Both Settings
This is where the two contexts connect. Low PTR and high PTR environments do not need the same intervention design, but they also do not represent separate problems.
In low-PTR settings, teacher-quality investment reaches students more directly because the time and conditions for it exist. In high-PTR settings, structured approaches are needed alongside teacher support, because teacher time is a structural constraint. What works at 12:1 does not automatically work at 47:1, and programme design should account for that before it reaches the school.
Conclusion
India’s PTR data from UDISE+ 2024-25 shows a decade of genuine national progress: all four stage PTRs now meet the NEP 2020 benchmark, and the teacher count crossing 1 crore marks sustained investment in teaching capacity.
The state-level gaps, however, remain wide, particularly at the secondary stage where the pressure on teachers is highest. For organisations planning government school programmes in states like Jharkhand, Maharashtra, or Uttar Pradesh, this data is not background context. It is a planning constraint. The PTR gap between states is wide enough that a programme design suited to Chhattisgarh may be structurally unworkable in Jharkhand.
iDream Education partners with CSR teams and NGOs to provide adaptive learning infrastructure designed for high-PTR environments where no single teacher can reach every student.
Sources
- Ministry of Education, PIB – UDISE+ 2024-25 press release (28 August 2025)
https://www.pib.gov.in/PressReleasePage.aspx?PRID=2161543 - UDISE+ 2022-23 Report Booklet
https://dashboard.udiseplus.gov.in/report-new-v.6-demo2025/static/media/UDISE+2022_23_Booklet_existing.d209e7c7516d77939da9.pdf - Economic Survey 2024-25, PIB (references UDISE+ 2023-24 data)
https://www.pib.gov.in/PressReleasePage.aspx?PRID=2097864 - India Development Review – A closer look at India’s expanding teaching workforce (January 2026)
https://idronline.org/article/education/a-closer-look-at-indias-expanding-teaching-workforce/ - Education For All in India – Analysis of Pupil-Teacher Ratios in India by Level of Education (UDISE+ 2024-25)
https://educationforallinindia.com/analysis-of-pupil-teacher-ratios-in-india-by-level-of-education/ - Education For All in India – Single-Teacher Schools and Schools without Enrolment (UDISE+ 2024-25) https://educationforallinindia.com/single-teacher-schools-schools-without-enrolment-analysis-of-udiseplus-2024-25/
Frequently Asked Questions -
1. What is a pupil-teacher ratio?
A pupil-teacher ratio (PTR) is the number of students per teacher in a school or education system. A PTR of 30:1 means each teacher is responsible for 30 students on average. Lower ratios allow more individual attention; higher ratios indicate greater teacher workload and less scope for personalised support.
2. What is India's latest pupil-teacher ratio?
India's national pupil-teacher ratio (PTR) across all school stages sits within the NEP 2020 benchmark of 30:1 as of 2024-25. The secondary stage PTR is 21:1, the middle stage is 17:1, the preparatory stage is 13:1, and the foundational stage is 10:1. This marks the first time all four stages have met the benchmark simultaneously.
3. Which Indian state has the highest pupil-teacher ratio?
Jharkhand has the highest higher secondary pupil-teacher ratio in India, at 47:1 as of 2024-25. This means a teacher at that level is, on average, responsible for 47 students. Maharashtra (37:1), Odisha (37:1), and Uttar Pradesh (35:1) also significantly exceed the national higher secondary PTR of 23:1.
4. Which Indian states have the lowest pupil-teacher ratio?
At the higher secondary stage (Classes 11–12), Sikkim (7:1), Ladakh (8:1), and Himachal Pradesh (9:1) record the lowest PTRs as of 2024-25. At the primary level, Ladakh (5:1) and Sikkim (6:1) also sit at the bottom of the national range.
5. What pupil-teacher ratio does NEP 2020 recommend for schools?
The National Education Policy (NEP) 2020 recommends a maximum PTR (pupil-teacher ratio) of 30:1 across all school stages. This benchmark applies from the foundational stage (pre-primary to Class 2) through secondary (Classes 9-12). As of 2024-25, India's national PTR meets this target at every stage, though several states remain above it at the higher secondary level.
6. What is a single-teacher school in India?
A single-teacher school is a government school where one teacher is responsible for all students, all grades, and all subjects. As of 2024-25, India has 1,04,125 such schools. Andhra Pradesh (12,912 schools), Uttar Pradesh (9,508), and Jharkhand (9,172) have the highest counts. In these schools, the concept of a state or national PTR average does not apply.
7. What does UDISE+ measure in school education?
The Unified District Information System for Education Plus (UDISE+) is India's official school education database, maintained by the Ministry of Education. It tracks data across approximately 14.71 lakh schools nationwide, covering enrolment, teacher counts, infrastructure, and learning outcomes.
8. At which school stage does India’s pupil-teacher ratio vary most between states?
The higher secondary stage (Classes 11–12) shows the widest variation. The national higher secondary PTR is 23:1, but state figures range from 7:1 in Sikkim to 47:1 in Jharkhand. Primary and upper primary PTRs are comparatively consistent across states.
Categories You may Explore
Related Articles