
Key Takeaways
- As per the UDISE+ report 2024-25, school dropout rates have fallen at every stage: Preparatory (Classes 3-5), Middle (Classes 6-8), and Secondary (Classes 9-12).
- The preparatory stage saw a decline from 3.7% in 2023-24 to 2.3% in 2024-25, the middle stage from 5.2% to 3.5%, and the secondary stage from 10.9% to 8.2% over the same period.
- 86.6% of students move from middle school into secondary school, a strong transition rate. But once they’re in, they aren’t finishing.
- Only 47.2% of students who enter the school system complete Class 12. That’s the lowest retention rate of any stage.
- 12 states and Union Territories report secondary dropout at or above 15%, led by West Bengal (20.0%), Arunachal Pradesh and Karnataka (18.3% each), and Assam (17.5%).
- Several states report exactly 0% primary dropout this cycle, including Uttar Pradesh, Madhya Pradesh, Telangana, and Jharkhand.
The National Education Policy (NEP) 2020 sets a target of 100% Gross Enrolment Ratio, from pre-school through Class 12, by 2030. The UDISE+ (Unified District Information System for Education Plus) 2024-25 report tracks India’s progress against that goal, and it’s the country’s main data source for doing so.[1]
The Ministry of Education released the report in August 2025.[1] This cycle’s headline number was good news: dropout fell at every stage UDISE+ measures. But one number sits underneath that good news, and it complicates things a bit. 52.8% of students who enter India’s school system don’t finish it.[1]
This article looks at where students are leaving the system and what the state-level data can and can’t tell us about this cycle.
What Dropout, Transition, and Retention Actually Measure
These three terms get used loosely, often interchangeably. But they don’t mean the same thing:
- Dropout rate: The share of students in a grade who leave school and don’t return the next year, without finishing that grade.
- Transition rate: The share of students that move from one stage to the next, for example, from Middle school to secondary school.
- Retention rate: The share of the original number of students that completes an entire stage, from entry to finish.
There’s one classification detail that matters here, though. UDISE+ defines “Secondary” in two different ways across its own reports. The Ministry’s press release uses the NEP four-stage structure, where Secondary means Classes 9 to 12 combined. On that basis, the national secondary dropout rate for 2024-25 is 8.2%.[1]
UDISE+ uses the traditional structure instead, where ‘Secondary’ means only Classes 9 and 10, with Classes 11 and 12 reported separately as ‘Higher Secondary’. On that basis, the national secondary dropout rate is 11.5%[2]. Both numbers come from the same UDISE+ 2024-25 release. So they’re measuring different grade spans under the same word.[2]
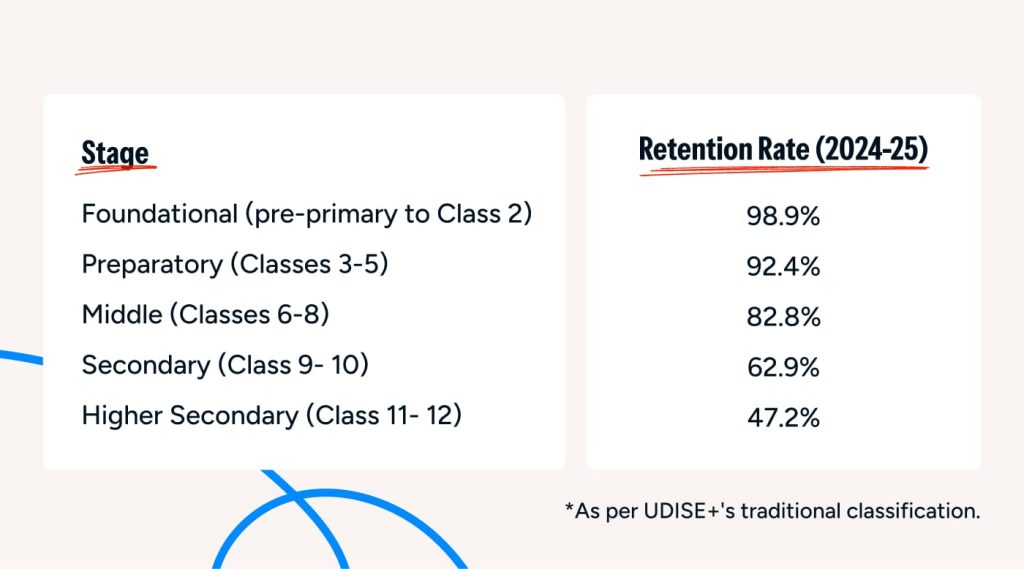
The traditional structure also shows something the four-stage numbers don’t. Retention through Class 10 is 62.9%, but by Class 12, it falls to 47.2%.[2] That means most of the drop-off happens after Class 10, not before it.
The National Picture
Here’s what the numbers show at the national level.
Dropouts Fell at Every Stage
Compared with the year before[1]:
- Preparatory dropout fell from 3.7% to 2.3%.
- Middle dropout fell from 5.2% to 3.5%.
- Secondary dropout, Classes 9 to 12 combined, fell from 10.9% to 8.2%.
| Stage | Retention Rate (2024-25) |
| Foundational (pre-primary to Class 2) | 98.9% |
| Preparatory (Classes 3-5) | 92.4% |
| Middle (Classes 6-8) | 82.8% |
| Secondary (Class 9- 10) | 62.9% |
| Higher Secondary (Class 11- 12) | 47.2% |
Dropout Leak Happens Inside Secondary School
The transition rate from Middle into Secondary school is 86.6%, up from 83.3% the year before. So students are reaching secondary school. But retention through Class 12 is only 47.2%. That gap, 86.6% entering versus 47.2% finishing[1], means the real drop-off happens after students arrive in secondary school, not before.
Enrolment Itself is Shrinking
Total enrolment across Classes 1 to 12 fell from 250.99 million in 2017-18 to 232.89 million in 2024-25, a 7.2% decline.[4] Falling birth rates and demographic shift explain part of it, though. That means some of the retention gain has to be read against a shrinking student base, not treated as a clean win.
That matters for reading the dropout numbers correctly. Dropout rate is a percentage of enrolled students, not a fixed count, so a shrinking enrolment base can make dropout rates look better even where the actual number of children leaving school hasn’t fallen by nearly as much.
Where the State Data Gets Complicated
Now, this cycle’s state-wise dropout data has a real problem. Several states report exactly 0% primary dropout, including Uttar Pradesh, Madhya Pradesh, Telangana, and Jharkhand.
States this large and this administratively varied don’t plausibly hit a literal zero. It’s more likely a data reporting issue than a real result. [2] [3]
That problem is only at the primary level. The secondary-level data doesn’t show the same zero-rate pattern. It’s more reliable for comparing states, though still not exact.
UDISE+ also breaks dropout down by gender, and the pattern doesn’t hold steady across stages.[2] Girls show a lower dropout rate than boys at the primary and secondary levels. At upper primary, though, that flips: boys are at 4.1%, well above girls’ 2.9% (the combined total is 3.5%), a wider gap than the year before.[2][3]Read the primary-level comparison with caution, though. Girls’ reported primary dropout rate is 0%, against boys at 0.8%, which fits the same implausible-zero pattern already flagged in this article, so that particular number isn’t a clean result.[3]
States With the Highest Secondary Dropout
12 states and Union Territories report secondary dropout (Classes 9-10) at or above 15%[2]:
| State/UT | Secondary Dropout Rate, 2024-25 |
| West Bengal | 20.0% |
| Arunachal Pradesh | 18.3% |
| Karnataka | 18.3% |
| Assam | 17.5% |
| Meghalaya | 17.4% |
| Mizoram | 17.4% |
| Gujarat | 16.9% |
| Madhya Pradesh | 16.8% |
| Ladakh | 16.2% |
| Andhra Pradesh | 15.5% |
| Chhattisgarh | 15.3% |
| Odisha | 15.0% |
Bihar carries the highest absolute dropout numbers nationally at the elementary level. Its secondary dropout rate is comparatively low, at 6.9%. But its upper-primary rate is high, at 9.3%[2]. This suggests Bihar’s retention problem shows up earlier in the system, at the elementary level, not at the secondary level.
States With the Lowest Secondary Dropout
At the other end, twelve states and Union Territories report secondary (Classes 9-10) dropout at or below 7%:
| State/UT | Secondary Dropout Rate, 2024-25 |
| Chandigarh | 2.0% |
| Jharkhand | 3.5% |
| Lakshadweep | 4.1% |
| Uttarakhand | 4.6% |
| Kerala | 4.8% |
| Andaman and Nicobar Islands | 5.4% |
| Puducherry | 5.9% |
| Himachal Pradesh | 6.2% |
| Punjab | 6.2% |
| Haryana | 6.6% |
| Bihar | 6.9% |
| Uttar Pradesh | 7.0% |
Jharkhand and Uttar Pradesh both appear here with low secondary dropout, but both are also on the list of states reporting an implausible 0% primary dropout, flagged earlier in this article. A state that looks clean at the primary level and secondary level in the same cycle is worth treating with the same caution as the 0% figure itself.[2][3]
Kerala, Himachal Pradesh, and Punjab don’t show the 0% primary-dropout data issue flagged earlier, which makes them the more credible entries on this list. [2]
What This Means for Programme Design
This is a planning input for organisations designing programmes, and the data points are presented in two different ways.
- Nationally, the system is improving. Dropout is falling at every stage.
Transition into secondary school is stronger than it’s been in the years UDISE+ has tracked it. So a programme built around the assumption that students aren’t reaching secondary school at all would be solving a problem that’s already shrinking. - The real gap is inside secondary school itself.
The traditional classification shows retention falls from 62.9% through Class 10 to 47.2% through Class 12. That means a meaningful share of attrition happens after the Class 10 board exam, not before it. So programmes here should focus on keeping students through Classes 11 and 12, not on getting them into secondary school.
At the state level, this data flag matters for anyone prioritising where to work. A state showing 0% primary dropout isn’t a solved problem; it’s likely a data error. The secondary-level numbers are more reliable. The twelve states above 15%, led by West Bengal, Arunachal Pradesh, and Karnataka, are a better guide for prioritising states.
Conclusion
UDISE+ 2024-25 tells an encouraging national story: dropout is down at every stage, and more students than ever are transitioning into secondary school. But retention through secondary school, at 47.2%, remains the lowest of any stage in the system. Moreover, the gap between transition and retention shows where students are actually leaving the system, inside secondary school.
State-level primary-dropout numbers from this cycle need that flag in mind. The steadier signal is the group of states with consistently high secondary dropout: West Bengal, Arunachal Pradesh, Karnataka, Assam, Meghalaya, Mizoram, Gujarat, and Madhya Pradesh.
iDream Education works with state education departments and CSR programmes in exactly this space. We build structured, self-paced learning support aimed at the stage where India is losing the most students: inside secondary school, after they’ve already arrived.
Source List
- Ministry of Education, PIB, UDISE+ 2024-25 press release (28 August 2025): https://www.pib.gov.in/PressReleasePage.aspx?PRID=2161543
- UDISE+ 2024-25 Report (Existing Structure), Department of School Education and Literacy, Table 6.13-6.15 (Dropout, Transition, and Retention Rate by level of education and gender): https://educationforallinindia.com/wp-content/uploads/2025/09/Dropout-Transition-and-Retention-Rate-UDISEPlus-2024-25-DSEL.pdf
- Prof. Arun C. Mehta, Analysis of UDISE+ 2024-25 Data, Education For All in India (near-zero primary dropout flag): https://educationforallinindia.com/analysis-of-udise-2024-25-data-by-prof-arun-c-mehta/
- Prof. Arun C. Mehta, State of Dropout, Transition, and Retention Rates based on UDISE+ 2024-25 Data, Education For All in India (enrolment decline figure): https://educationforallinindia.com/state-of-dropout-transition-and-retention-rates-based-on-udiseplus-2024-25-data/
Frequently Asked Questions -
1. What is India's school dropout rate in 2024-25?
Preparatory-stage dropout is 2.3%, Middle-stage is 3.5%, and Secondary-stage (Classes 9-12 combined) is 8.2%. All three fell from the year before.
2. What's the difference between dropout rate, transition rate, and retention rate?
Dropout rate measures students who leave without finishing a level. Transition rate measures students moving from one stage to the next. Retention rate measures how many students from an original group finish an entire stage, from start to end.
3. Which states have the highest secondary school dropout rates?
West Bengal (20.0%), Arunachal Pradesh and Karnataka (18.3% each), and Assam (17.5%) have dropout rates at or above 15%.
4. Which states have the lowest secondary school dropout rates?
Chandigarh (2.0%), Kerala (4.8%), Himachal Pradesh (6.2%), and Punjab (6.2%) are among the most credible low-dropout states. Jharkhand and Uttar Pradesh also report low secondary dropout, but both carry a separate data-quality flag at the primary level, so their secondary numbers are worth reading with that in mind.
5. Why does the dropout rate look better than the retention rate?
Because the dropout rate and retention rate measure different things. Retention through Class 12 is 47.2%, even though the transition rate into secondary school is a strong 86.6%. Students are getting in. The bigger loss happens after Class 10, inside secondary school, not at its entrance.
6. Do dropout rates differ by gender in India?
Yes, though not in the same direction at every stage. Girls have a lower dropout rate than boys at the primary and secondary levels. At upper primary, that flips: boys (4.1%) run higher than girls (2.9%). The primary-level gender numbers carry the same data-reliability caveat as the states reporting 0% dropout, since girls' primary dropout rate is itself reported at 0.0%.
Categories You may Explore
Related Articles