Key Takeaways
- PARAKH Rashtriya Sarvekshan, India’s national learning assessment, tested 21.15 lakh students across Grades 3, 6, and 9. It is the largest system-level survey India has run. The latest survey was conducted on 4 December, 2024.
- A key finding was that performance drops sharply as grade level rises. Grade 3 students scored 64% in Language and 60% in Mathematics. By Grade 9, Language fell to 54% and Mathematics to around 37%.
- Mathematics is the lowest-scoring subject at Grades 3, 6, and 9, and it falls further behind the other subjects at each higher grade.
- For Grade 3, Language and Mathematics both improved from 2021. But both were still below 2017, the last pre-pandemic score.
- Punjab is the most consistent top performer, with the highest average scores across nearly every grade, subject, and subgroup breakdown in the report.
- Grade 9 students struggle with core mathematics skills: only 28% of Grade 9 students could correctly apply percentages, and only 29% could work with fractions.
PARAKH stands for the Performance Assessment, Review, and Analysis of Knowledge for Holistic Development. It’s the Ministry of Education’s national assessment body. The latest survey was in 2024: PARAKH Rashtriya Sarvekshan 2024 is its first large-scale learning survey, replacing what used to be called the National Achievement Survey (NAS).
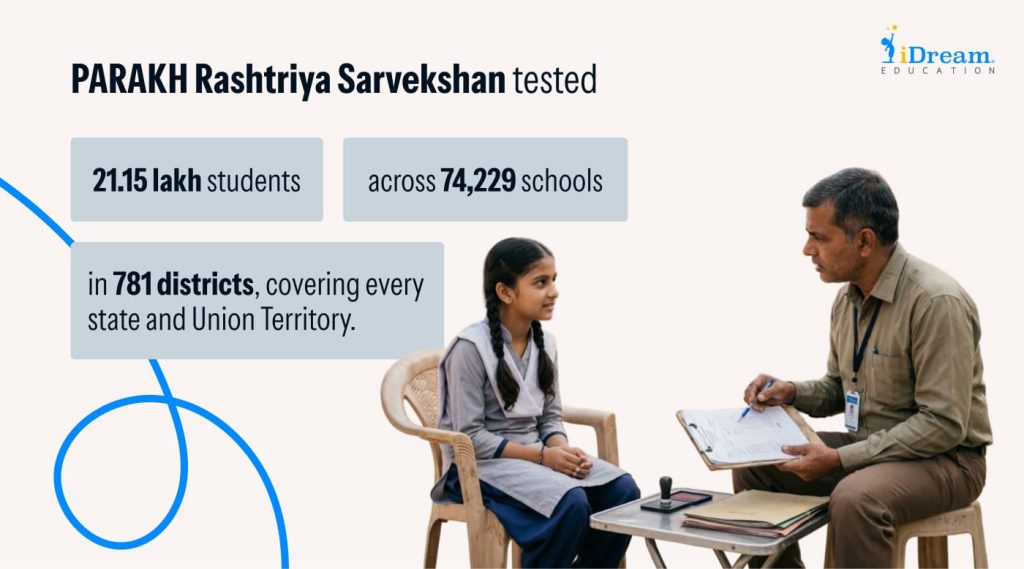
The survey tested 21.15 lakh students across 74,229 schools in 781 districts, covering every state and Union Territory.[1] [2]
These are the most recent numbers available, and they’ll remain the reference point until PARAKH runs its next cycle, which hasn’t been scheduled yet. Learning outcomes tend not to shift dramatically over a year or two, so the 2024 findings still serve as a reasonable working baseline for programme design and target-setting today.
Here we look at what the results actually showed and where the state-level picture varies, and what the specific competency gaps mean for anyone designing learning programmes.
What PARAKH Measures
PARAKH Rashtriya Sarvekshan 2024 tested three grades: 3, 6, and 9. Each marks the end of a school stage under the National Education Policy (NEP) 2020: Foundational (Grade 3), Preparatory (Grade 6), and Middle (Grade 9).[2]
The subjects tested changed by grade. Every grade covered Language and Mathematics, but Grade 6 added The World Around Us, and Grade 9 replaced it with Science and Social Science.[2]
Scores throughout this article are the percentage of students who answered a competency-based, multiple-choice question correctly, whether that’s working with fractions in Grade 6 or interpreting a historical source in Grade 9.
However, not every grade can be compared across years. PARAKH Rashtriya Sarvekshan 2024 tested Grades 3, 6, and 9. NAS 2017 (National Achievement Survey, the assessment PARAKH replaced) tested Grades 3, 5, and 8, and NAS 2021 tested Grades 3, 5, 8, and 10.
Because the grades don’t line up, only Grade 3 can be compared directly across all three cycles. Grade 6 in 2024 can’t be compared to Grade 5 before it, nor Grade 9 to Grade 8, since scores naturally fall as students move up a grade and the comparison would be unfair. That’s why this article limits year-on-year comparisons to Grade 3, and why any Grade 6 or Grade 9 trend claim built by lining up NAS and PARAKH scores directly should be treated with caution.[3]
How Scores Compare Nationally
PARAKH 2024 shows three things clearly:
- scores by grade
- where Grade 9 falls short
- how Grade 3 has moved over time
Scores by Grade
Scores fall as students move up through school, in both subjects, at every stage. Language holds up better than Mathematics throughout, but the gap between the two widens sharply by Grade 9, when Mathematics hits the lowest point recorded anywhere in the survey.[2]
The table below breaks down the exact numbers by grade:
| Grade (Stage) | Language | Mathematics |
| Grade 3 (Foundational) | 64% | 60% |
| Grade 6 (Preparatory) | ~57% | ~47% |
| Grade 9 (Middle) | 54% | ~37% |
Note: Grade 6 and Grade 9 figures are calculated from the boy-girl score breakdown the report provides; the report doesn’t print a single combined national score for these two grades the way it does for Grade 3.[2]
Grade 9’s Weakest Subjects
Mathematics isn’t the only weak subject at Grade 9. Science and Social Science both scored around 40%, close to Mathematics’ 37%. Language, at 54%, was the only subject above the halfway mark of 50%.[2]
The Grade 3 Trend
Over time, Grade 3 has moved in a mixed direction. Language rose from 62% (NAS 2021) to 64% (2024), and Mathematics rose from 57% to 60%. Both are real gains, but both still are below NAS 2017, when Grade 3 scored 68% in Language and 64% in Mathematics.[3]
Where Performance Varies by State
The national averages hide big gaps between states. A few states lead consistently, and a few lag consistently.
States With the Strongest Performance
Punjab appears at or near the top for both Language and Mathematics across nearly every subgroup breakdown in the report, whether by gender, location, or school type, and across all three grades.[2]
| Breakdown | Top 5 states (in order) |
| Grade 3, Language, state government schools | Punjab, Himachal Pradesh, Kerala, Uttar Pradesh, Maharashtra |
| Grade 3, Mathematics, state government schools | Punjab, Himachal Pradesh, Kerala, Uttar Pradesh, Dadra & Nagar Haveli, and Daman & Diu |
| Grade 3, Language, where girls outperform boys | Punjab, Kerala, Himachal Pradesh, Manipur, Rajasthan |
Source: PARAKH Rashtriya Sarvekshan 2024 National Report, NCERT[2] .
Kerala and Himachal Pradesh appear almost as often as Punjab. Together, these three states consistently outperform the rest of the country across grades and subjects.[2]
States and Districts With the Lowest Scores
The report doesn’t publish a single state-wise ranking table. What it does publish is a list of the 50 highest- and 50 lowest-scoring districts for each grade. It also names specific states with lower scores within certain subgroup breakdowns. Reading across all three grades’ low-scoring district lists, one region stands out clearly: Meghalaya’s Garo Hills. North, South, East, and West Garo Hills, along with the neighbouring Khasi Hills districts, appear repeatedly among the lowest-scoring districts at Grade 3, Grade 6, and Grade 9.[2]
Districts in Jammu & Kashmir, Mizoram, and Nagaland also appear repeatedly across grades on these lists, concentrated mostly in the Northeast and Jammu & Kashmir.[2]
Which Subjects Show the Sharpest Learning Gaps
If fewer than half of students get a question right, PARAKH counts that competency as a gap needing intervention. By that standard, Mathematics has far more gaps than any other subject at Grade 6 and Grade 9, and the specific problem types are familiar ones: fractions, unit conversion, percentages, and logical reasoning.[2]
| Competency | Grade | % answering correctly |
| Working with fractions | Grade 6 | 29% |
| Unit conversion (for example, centimetres to metres) | Grade 6 | 38% |
| Applying percentages to solve problems | Grade 9 | 28% |
| Logical proofs and mathematical reasoning | Grade 9 | 29% |
| Working with fractions and ratios | Grade 9 | 31% |
At Grade 9, Science and Social Science show similar patterns. Only 33% of students could describe how simple electrical circuits work, and only 32% could interpret multiple historical sources to draw a conclusion. Both are core competencies for their subjects.[2]
What This Means for Programme Design
This is a planning input for organisations designing learning interventions, and it points to a specific stage rather than a system-wide problem.
The steepest drop sits between Grade 6 and Grade 9, concentrated in Mathematics: from around 47% to around 37%, while Language holds relatively steady. That specificity matters for programme design. A programme built for a general decline looks different from one built to fix a Mathematics-specific gap that opens up at a particular stage.
The competency-level detail matters more than the headline percentages here. Knowing that only 28% of Grade 9 students can apply percentages is a more useful starting point than knowing the subject average is 37%. It points to a specific, teachable skill, not just a general sense that maths needs work.
At the state level, the consistent strength of Punjab, Kerala, and Himachal Pradesh across grades and subjects suggests something structural is working in those systems, worth studying closely before any of it gets replicated elsewhere. Meghalaya’s Garo Hills region, along with parts of Jammu & Kashmir, Mizoram, and Nagaland, show a steadier pattern of lower scores across grades than most other states. That consistency gives programme planners a clearer picture of where system-level support is needed most.
Conclusion
PARAKH Rashtriya Sarvekshan 2024 is India’s largest system-level learning assessment so far, and its clearest finding is that competency gaps widen as students move through school. Grade 3 students perform reasonably well in Language and Mathematics. By Grade 9, Mathematics scores have fallen to around 37%, and specific, testable skills like working with percentages and fractions are missing for most students.[2]
The state-level picture reinforces a pattern. Punjab, Kerala, and Himachal Pradesh perform consistently well across measures, while Meghalaya, Mizoram, and parts of Jammu & Kashmir and Nagaland show up repeatedly on the other end.
A Mathematics gap in fractions for a Grade 6 student in one state and a Social Science gap in source interpretation for a Grade 9 student in another call for different fixes. Closing gaps like these takes learning support that adapts to where each student actually stands, not a single remediation track rolled out system-wide.
iDream Education partners with state education departments and CSR programmes to build personalised, competency-based learning support aimed at exactly the gaps this data identifies. That means specific, testable skills students are missing well before they reach the grades where those gaps compound.
Source List
- Ministry of Education, PIB, PARAKH Rashtriya Sarvekshan 2024 survey announcement (3 December 2024): https://www.pib.gov.in/PressReleaseIframePage.aspx?PRID=2080272
- PARAKH Rashtriya Sarvekshan 2024 National Report, NCERT (published July 2025): https://parakh.ncert.gov.in/sites/default/files/2025-07/REPORT_India_IND.pdf
- Observer Research Foundation, Tracking Regional Disparities in Learning Outcomes (December 2025): https://www.orfonline.org/research/tracking-regional-disparities-in-learning-outcomes
Frequently Asked Questions -
1. What is PARAKH Rashtriya Sarvekshan 2024?
PARAKH Rashtriya Sarvekshan 2024 is India's national learning assessment survey, conducted by PARAKH under NCERT and the Ministry of Education. It replaced the National Achievement Survey and tested 21.15 lakh students across Grades 3, 6, and 9 on 4 December 2024.
2. When was the most recent PARAKH Rashtriya Sarvekshan conducted, and is a new one planned?
PARAKH Rashtriya Sarvekshan 2024 is the latest cycle so far, conducted on 4 December 2024. The Ministry of Education hasn't announced a date for the next survey yet, which means the 2024 findings remain the most current system-level learning data available for programme and policy planning.
3. What subjects and grades does PARAKH 2024 cover?
Grade 3: Language and Mathematics. Grade 6: Language, Mathematics, and The World Around Us and Grade 9: Language, Mathematics, Science, and Social Science.
4. How did students perform in PARAKH 2024?
Grade 3 students scored 64% in Language and 60% in Mathematics. Scores fell at higher grades: Grade 9 Language was 54%, and Grade 9 Mathematics was around 37%, the lowest score recorded for any subject at any grade.
5. Can PARAKH 2024 results be compared to previous National Assessment Survey (NAS) survey cycles?
Only for Grade 3. NAS 2017 tested Grades 3, 5, and 8. NAS 2021 tested Grades 3, 5, 8, and 10. PARAKH 2024 tested Grades 3, 6, and 9. Grade 3 is the only grade common to all three cycles, so it's the only valid basis for a trend comparison.
6. Which states performed best in PARAKH 2024?
Punjab was the most consistent top performer across grades, subjects, and subgroups. Kerala and Himachal Pradesh also appear repeatedly among the strongest-performing states.
7. Which states or districts scored lowest in PARAKH 2024?
The report publishes district-level high and low performer lists rather than a single state ranking. Meghalaya's Garo Hills districts, along with districts in Jammu & Kashmir, Mizoram, and Nagaland, appear repeatedly among the lowest-performing districts across all three grades tested.
Categories You may Explore
Related Articles